TrueFoundry AI Gateway is a unified API gateway that provides observability, cost tracking, rate limiting, and access control for AI model inference. By routing your Cerebras requests through TrueFoundry, you gain comprehensive visibility into your AI operations while maintaining centralized control over access and spending.Key benefits include:
Comprehensive Observability - Track all API calls, latencies, and errors in one place with detailed request logging
Cost Management - Monitor and control spending across models and teams with real-time cost tracking
Access Control - Manage API keys and permissions centrally with role-based access
Rate Limiting - Protect your applications from unexpected usage spikes with configurable limits
Analytics Dashboard - Visualize usage patterns and performance metrics across your organization
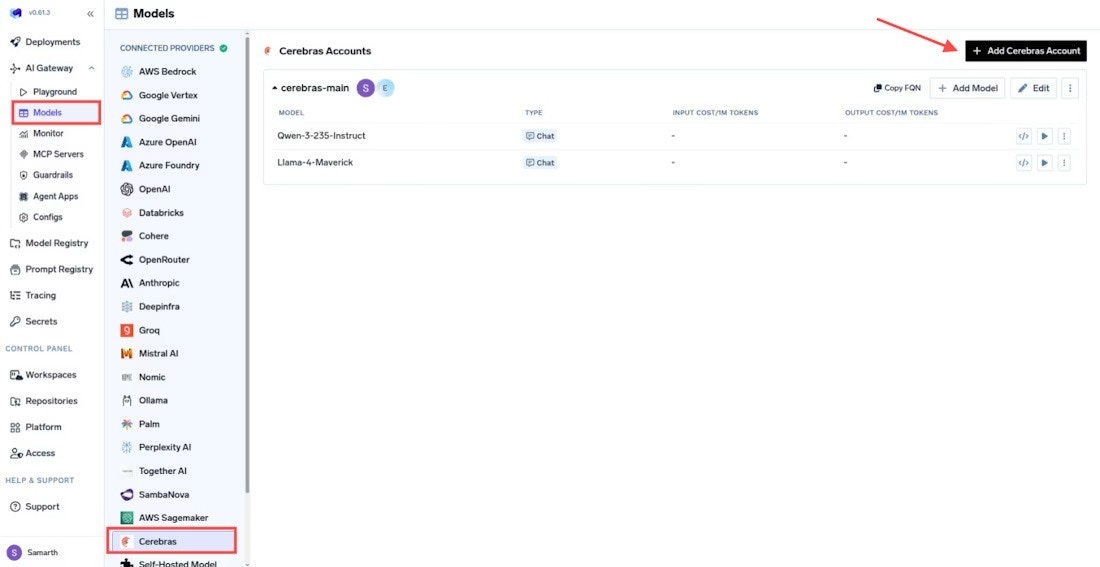
From the TrueFoundry dashboard, navigate to the Cerebras models section:
Go to AI Gateway > Models > Cerebras
Navigate to AI Gateway > Models > Cerebras
This opens the Cerebras configuration panel where you’ll add your account and models.
2
Add your Cerebras account
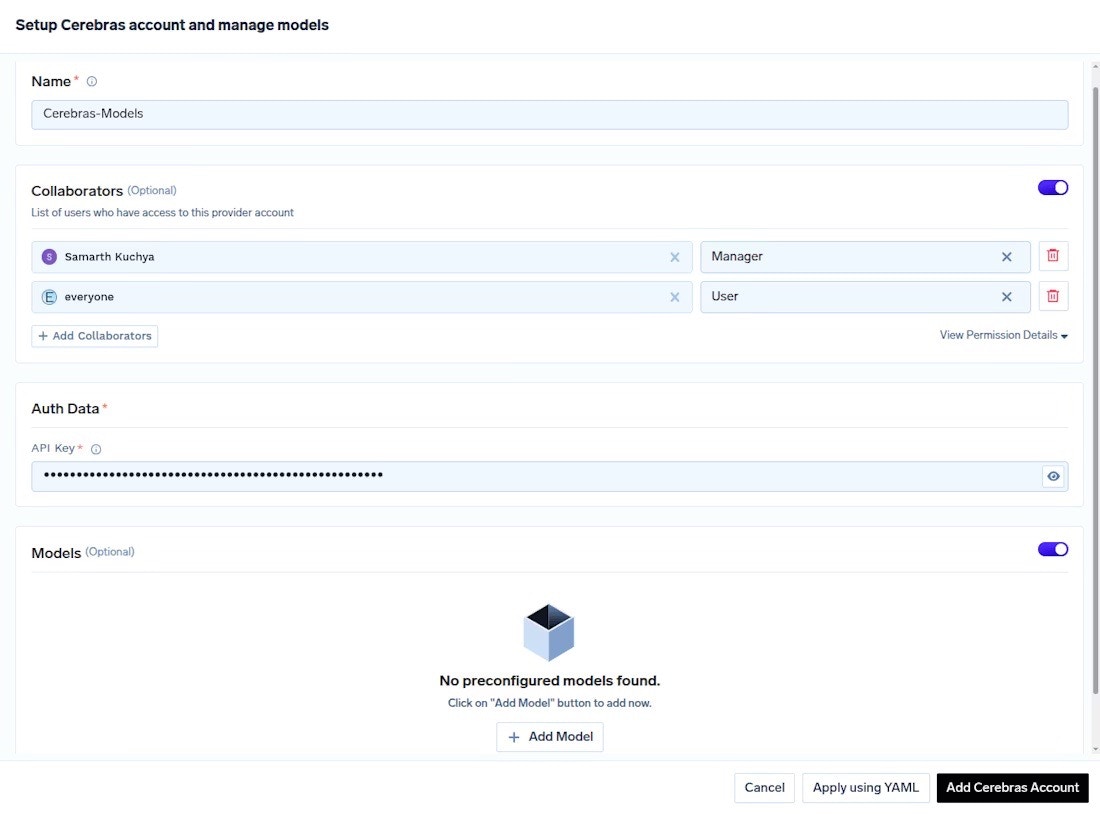
Click Add Cerebras Account to configure your Cerebras API credentials:
Add your Cerebras account credentials
Click the Add Cerebras Account button
Enter your Account Name (e.g., “Production” or “Development”)
Enter your Cerebras API Key from the prerequisites step
Optionally add Collaborators who should have access
Click Save
You can configure multiple Cerebras accounts with different access controls. This is useful for separating production and development environments or managing different teams. See Access Control for more details.
3
Add Cerebras models
Click + Add Model to add Cerebras models to your gateway. Unlike other providers, you need to get the Model ID directly from the Cerebras documentation.To add a model:
Configure any model-specific settings like rate limits or access controls
Click Save to activate the model
For Cerebras, you don’t select from a dropdown list. Instead, copy the exact Model ID from the Cerebras docs and paste it in the Model ID field.
4
Get your TrueFoundry API credentials
After configuring your models, TrueFoundry will provide you with gateway credentials. These credentials authenticate your application to the TrueFoundry gateway, which then routes requests to Cerebras.Find your credentials in the AI Gateway settings:
Navigate to AI Gateway > API Credentials
Copy your Gateway Base URL (e.g., https://gateway.truefoundry.ai)
Copy your Gateway API Key (a JWT token)
Keep these credentials secure - they provide access to all models configured in your gateway.
5
Install required dependencies
Install the OpenAI Python SDK, which is compatible with Cerebras through TrueFoundry’s OpenAI-compatible API:
pip install openai python-dotenv
The python-dotenv package helps manage environment variables securely.
6
Configure environment variables
Create a .env file in your project directory to store your TrueFoundry credentials securely:
Replace the placeholder values with your actual credentials from Step 4.
Never commit your .env file to version control. Add it to your .gitignore file to keep your credentials secure.
7
Initialize the client
Set up the OpenAI client to route requests through TrueFoundry’s gateway. The gateway intercepts your requests, captures observability data, and forwards them to Cerebras.
Use the model ID returned by TrueFoundry model discovery, such as cerebras/gpt-oss-120b. The provider-account prefix tells the gateway which configured Cerebras account should handle the request.
TrueFoundry supports streaming responses from Cerebras models, allowing you to process tokens as they’re generated. This is ideal for building responsive chat interfaces or processing long-form content.
import osfrom openai import OpenAIfrom dotenv import load_dotenvload_dotenv()client = OpenAI( api_key=os.getenv("TRUEFOUNDRY_API_KEY"), base_url=os.getenv("TRUEFOUNDRY_BASE_URL"), default_headers={ "X-Cerebras-3rd-Party-Integration": "TrueFoundry" })# Stream the responsestream = client.chat.completions.create( model="cerebras/gpt-oss-120b", messages=[ {"role": "user", "content": "Write a short story about a robot."} ], stream=True)for chunk in stream: if chunk.choices[0].delta.content is not None: print(chunk.choices[0].delta.content, end="")
Add custom metadata to your requests for better tracking and analytics. TrueFoundry captures these headers and makes them available in your analytics dashboard for filtering and analysis.
These custom headers will appear in your TrueFoundry analytics dashboard, making it easy to filter and analyze requests by user, session, or environment.
TrueFoundry allows you to set rate limits and budget controls directly in the dashboard to prevent unexpected costs and manage usage across your organization.To configure rate limits:
Navigate to AI Gateway > Rate Limiting
Configure limits per user, API key, or model
Set daily or monthly budget caps to prevent unexpected costs
Configure alerts to notify you when limits are approached
Create virtual models that combine multiple Cerebras models with custom routing logic, fallback strategies, and load balancing. This allows you to optimize for cost, performance, or availability.Learn more in the TrueFoundry Virtual Models documentation.
Access detailed logs for all requests through the TrueFoundry dashboard. Each log entry includes the full request and response payload, latency metrics, token usage, and any custom metadata you’ve added.To view logs:
Go to AI Gateway > Observability > Request Logging
Filter by model, user, time range, or custom metadata
View request and response payloads, latencies, and errors
Export logs for further analysis or compliance requirements
Monitor your Cerebras spending in real-time with TrueFoundry’s cost tracking dashboard. View costs broken down by model, user, team, or any custom dimension you’ve configured.To access cost tracking:
Navigate to AI Gateway > Cost Tracking
View costs broken down by model, user, or time period
Visualize usage patterns and performance metrics across your organization with TrueFoundry’s analytics dashboard. Track key metrics like request volume, latency percentiles, error rates, and token usage.Key metrics available:
Request Volume - Total requests over time, broken down by model
Latency - P50, P95, and P99 latency percentiles
Error Rates - Track errors by type and model
Token Usage - Monitor input and output tokens across models
Cost Trends - Visualize spending patterns over time